COMER web server help
Table of contents
- Introduction
- Homology search
- Workflow
- Input
- Profile construction
- Profile databases
- Results and supported services
- Homology examples
- Execution times
- Limits
- References
Introduction
The COMER web server provides services for protein analysis by homology. It is powered by the COMER2 homology search engine. COMER2 is a sensitive and specific homology search method [1] that accelerates homology searches by harnessing the power of GPUs [2]. The COMER2 software architecture allows for simultaneously running multiple instances of homology search on the same GPU independently. This property allows the webserver to efficiently exploit computational resources and distribute workload across multiple dedicated GPUs.
Homology search
The server allows for an analysis of the results of COMER2. COMER2 is a profile-profile comparison and alignment method whose homology search is based on comparing the query profile (sequence family) model with the entries (profiles) of selected database(s). It employs a fast GPU-accelerated search engine.
Workflow
The workflow for using the COMER2 tool in the webserver environment is shown in Fig. 1. The user is expected to enter her or his queries, select databases, adjust parameters if desired, and hit the Submit button. Information displaying the progress of the job will show up. The results will appear once the job has finished. An e-mail with a link to the results will be sent if the e-mail address was provided by the user.
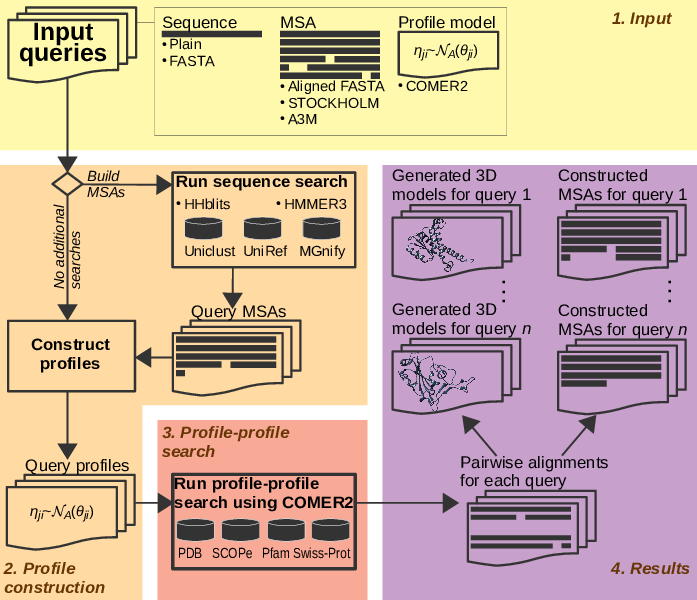
The user can provide sequences, plain and in FASTA format, MSAs in aligned FASTA, STOCKHOLM, and A3M formats, and COMER2 profiles—all in the same input field. The server automatically determines the format of input data.
The COMER web server can be instructed to build informative and diverse MSAs for user queries (profiles excluded). In that case, the server performs additional sequence searches with user queries using HHblits [3], HMMER3 [4], or both and builds MSAs from statistically significant hits. When using both these tools, an MSA for each query results from combining sequence alignments produced independently by them, which is useful for query sequences with low homology.
Each sequence and MSA corresponding to a user query is subjected to profile construction. COMER2 profiles include secondary structure (SS) predictions [5] made for query proteins.
The format in which the results of a profile-profile search appear includes for each user query a list of pairwise alignments between the query and a database sequence, both representing constructed profiles. Produced alignments are amenable to further analysis. Their different selection combinations for a query allow the user to construct different MSAs and generate 3D structural models by homology to detected proteins [6] in bulk when those protein sequences have a known structure.
Input
The user is allowed to enter multiple queries in different formats. Processing user queries in bulk removes the limitation of focusing on a single protein of interest at a time and allows the server to utilize computing power efficiently. Results will be provided by the server for each query. The number of queries in the input field is limited to 100 for COMER2 searches. Maximum size of queries in the text field is 5 MB, and maximum file size for upload of queries is 50 MB.
Individual queries are separated by the line "//". The format of a query is recognized automatically. Currently, these formats are supported for sequences: plain sequence and FASTA. A multiple sequence alignment (MSA) can be provided in these formats: aligned FASTA (FASTA with gaps "-" allowed), STOCKHOLM, and A3M. Also, the server recognizes COMER2 profiles as individual queries.
An example of an input record containing multiple queries is shown below:
KAITKERDSDFVKELFHQPELMADEEELQRATEQVVEMIENFKSFSLHFPLFWYDERYCISNILELEDLDEVWHTLPNDESCVDLWNMYKN
//
>1BKV_C T3-785; COLLAGEN, HYDROXYPROLINE, HYDROGEN BONDING, TRIPLE; HET: HYP, ACY; 2.0A {N/A} SCOP: k.3.1.1
PPGPPGPPGITGARGLAGPPGPPGPPGPPG
>tr|H9FJ52|H9FJ52_MACMU Collagen alpha-1(XXIV) chain (Fragment) OS=Macaca mulatta GN=COL24A1 PE=2 SV=1
PRGEKGFRGETGPQGPRGQPGPPGPPGAPG
>tr|B4KBY1|B4KBY1_DROMO Uncharacterized protein OS=Drosophila mojavensis GN=Dmoj\GI10190 PE=4 SV=2
PPGPPGPPGppgPpgpPGPRGFTGATGPRGRDAPRT
//
>OsSUT1, RICE LEAVES, 538 residues|
MARGSGAGGGGGGGGGGLELSV-GVGG---GGG--------A-RGG----GG-G-E-A--AAAV----ETA---AP-I--S-LGR---L-I-L--SGM--V-A
>UniRef50_A0A444XBP0/16-506 (16-506) Uncharacterized protein n=2 Tax=Arachis hypogaea TaxID=3818 RepID=A0A444XBP0_ARAHY  Expect=3.8e-184  Expect=3.8e-184
---------------------------------------------------N-S-L-Q--LESG----SRE---QP-S--P-IWK---L-V-A--VAS--I-A
>UniRef50_A0A251VK29/1-393 (1-393) Putative sucrose/H+ symporter, plant, Major facilitator superfamily domain protein n=1 Tax=Helia  Expect=1e-129  Expect=1e-129
--------------------------------------------------------------------------------------------M--VSA--I-A
//
The last separator in the input field is optional. If only one MSA in aligned FASTA format is provided, the user can activate a checkbox to instruct the server to treat each sequence in the MSA as an individual query (gaps are ignored). In that case, the server will process multiple query sequences, corresponding to the number of sequences in the MSA, instead of one MSA.
For example, the following input
>OsSUT1, RICE LEAVES, 538 residues|
MARGSGAGGGGGGGGGGLELSV-GVGG---GGG--------A-RGG----GG-G-E-A--AAAV----ETA---AP-I--S-LGR---L-I-L--SGM--V-A
>UniRef50_A0A444XBP0/16-506 (16-506)
---------------------------------------------------N-S-L-Q--LESG----SRE---QP-S--P-IWK---L-V-A--VAS--I-A
>UniRef50_A0A251VK29/1-393 (1-393)
--------------------------------------------------------------------------------------------M--VSA--I-A
can be configured to represent three different queries (sequences in the MSA).
Profile construction
The COMER2 profile is constructed from an MSA. A profile and an MSA can be provided directly (see Input). Otherwise, or optionally in the case of MSAs, the query is searched in sequence database(s) to build an MSA. Sequence search can be configured to be conducted using either HHblits [3] or HMMER [4] or both. The latter means that HHblits and HMMER are used independently, and their resulting pairwise sequence alignments are combined into a final MSA. Note that if an MSA provided as a query is to be searched for, it first undergoes (HHblits and/or HMMER) profile construction followed by a profile-to-sequence search.
Profile databases
The following profile databases are available for COMER2 search:
- PDB filtered to 70% sequence identity (PDB70) [7],
- SCOPe70 [8],
- Pfam [9],
- UniProtKB/Swiss-Prot filtered to 90% sequence identity [10],
- ECOD-F70 [11],
- COG-KOG [12],
- NCBI-CDD [13].
Multiple databases can be selected (Ctrl key + Mouse's left-click) before submitting a job.
Results and supported services
The format of COMER2 results is as follows. First, the list of links to the results for each query is displayed. By clicking on the links, the detailed results for individual queries are shown (Fig. 2).
Results show the list of pairwise profile-profile (COMER) alignments.
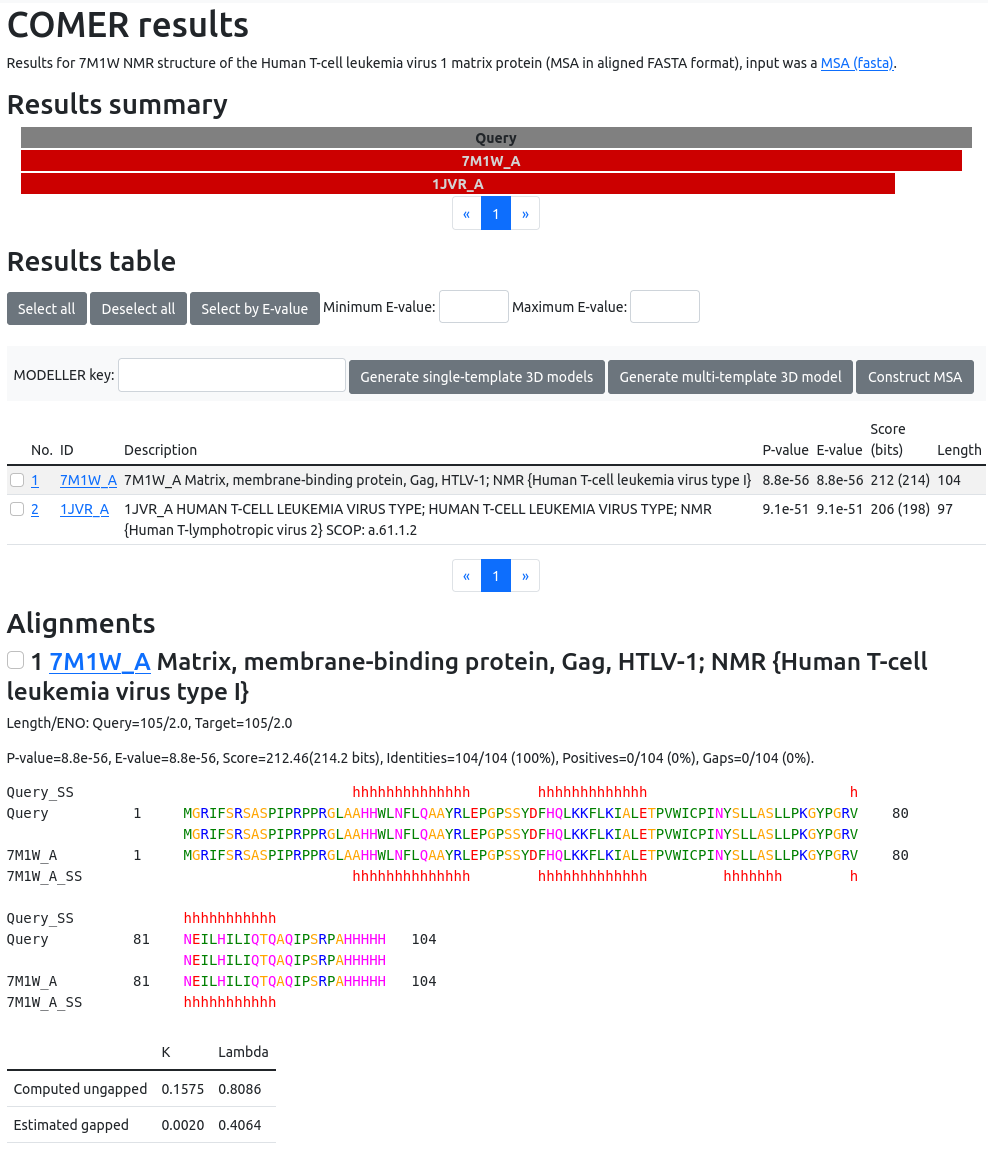
A profile-profile alignment between a query and an identified protein is shown along with predicted secondary structures, which help visually assess how well structural features align.
Alignment statistics accompany each alignment:
- The length and the effective number of observations (ENO) per position of the query and the identified protein represent the profile length and informativeness, respectively. ENO rarely exceeds 14, and a profile is considered informative if it is greater than 4.
- E-value and P-value = 1 - exp(-(E-value)) are the statistical significance estimates of the produced alignment.
- Score is the profile-profile alignment score upon which the statistical significance estimates depend.
- Bit score given in parentheses is a database size-independent measure (as opposed to E-value and P-value) and can be used to compare alignment significance across different database searches.
- Identities, Positives, and Gaps show the number of pairs of identical amino acids, positive profile-profile substitution scores, and gaps in the alignment, respectively. Their percentages sum to 100%.
- Note that an aligned pair of identical amino acids may not imply a positive substitution score if the amino acid is not conserved and the amino acid distributions differ at the corresponding profile positions.
- The table of the statistical parameters Lambda and K follows the profile-profile alignment. K and Lambda estimated for gapped alignments are used to calculate E-value and P-value, and their values depend on the values computed from the profile-profile score matrix (Computed ungapped). The computed value of Lambda is an indicator of compositional similarity between the profiles (sequence families) being compared. Compositional similarity increases with decreasing values of Lambda. The measure of compositional similarity is used when calculating E-value and P-value.
The original input, final MSA, profile, log files, and the result file in JSON format are all available for download for each query.
The COMER web server offers services at the sequence, structure, and function levels. At the sequence level, alignments produced by COMER2 can be selected individually or as a group for building an MSA based on accurate profile-profile alignments. The latter option is particularly useful when the number of produced alignments is large, and only their subset with an E-value within a given interval is of interest. Visualization of a resulting MSA allows for interactive analysis of aligned sequences.
Structural analysis is possible through 3D structural model generation with Modeller [6] using the structures of identified proteins as templates and produced alignments as restraints. A multiple selection option allows the user to generate one model using multiple templates (up to 7) or multiple models (currently up to 15), one for each selected alignment, with one click of a button. Interactive visual analysis of generated models is maintained.
The functional inference is based on the results of searching annotated databases. For example, a statistically significant alignment between a query and a protein from the deeply annotated UniProtKB/Swiss-Prot database supplemented with SS predictions may provide strong evidence for a functional relationship. In general, simultaneous searching across all available profile databases enables the analysis of the proteins of interest at the sequence, structure, and function levels at the same time.
The services are activated by submitting a job. Once the results are ready, a visualization layer is added to depict results graphically.
Homology examples
PF11821
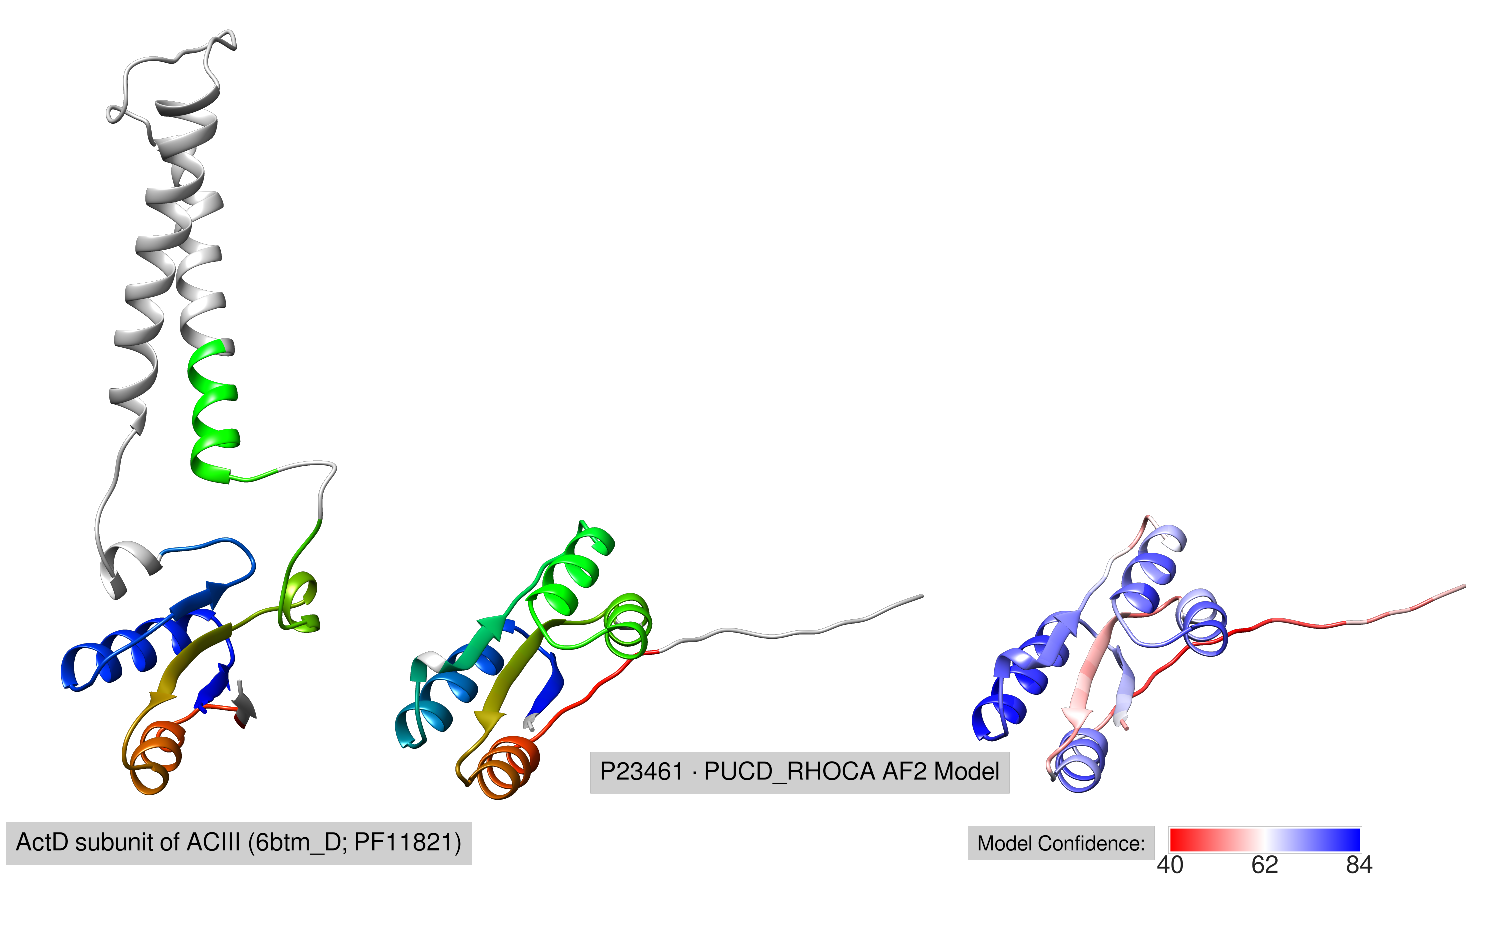
The most significant hit identified by COMER2 with E-value=1.6e-7 for Pfam DUF family PF11821 when searching the UniProtKB/Swiss-Prot90 (2021_03) database was P23461 (6% sequence identity), Rhodobacter capsulatus protein PucD. The search took 37 sec to run on the COMER web server.
In Pfam 35.0, PF11821 was classified as the ActD subunit (PDB ID: 6btm_D) of the Alternative complex III (ACIII). The function of the ActD subunit is unknown, but some evidence suggests that it may play a role in stabilizing the ACIII complex, a key component of bacteria respiratory and/or photosynthetic electron transport chains.
PucD is a subunit of the LHII light-harvesting complex, involved in the electron transport chain. Although the function of PucD is unknown, experiments have shown PucD to be involved in stabilizing the LHII complex.
The AlphaFold2 model of PucD shows the same fold as ActD, where ActD has an insertion of two transmembrane helices (see the Figure). The structural and molecular context similarity suggests that the relationship between ActD (PF11821) and PucD (P23461) identified by COMER2 is homologous.
PF09196
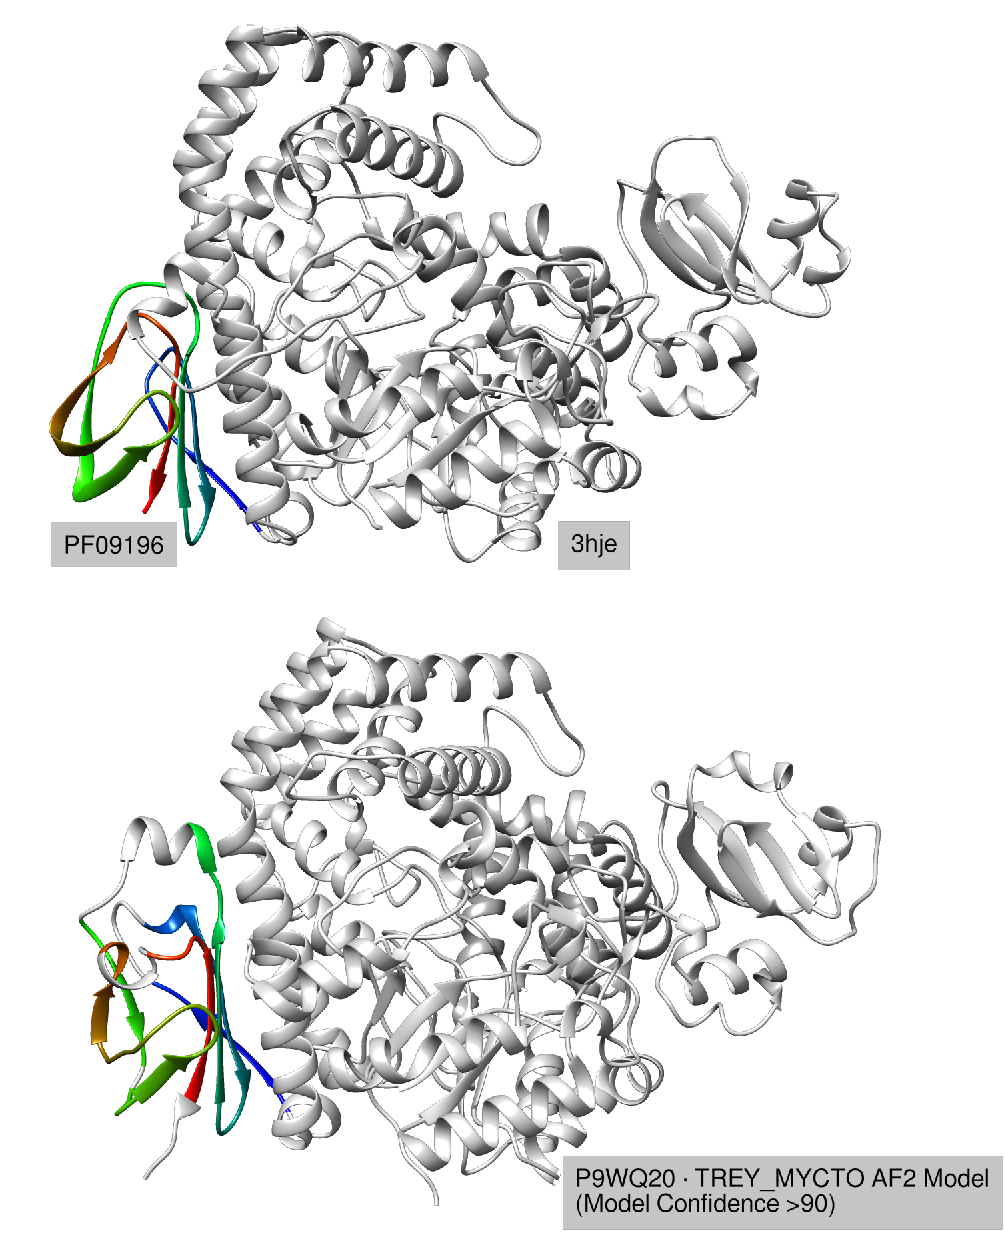
In Pfam 35.0, the PF09196 family consists of a single sequence, a Sulfolobus tokodaii maltooligosyl trehalose synthase domain (PDB ID: 3hje:642--704), with an unknown function (see the Figure below). No significant hits to the UniProtKB/Swiss-Prot90 (2021_03) database have been produced.
A more informative MSA (29 sequences) for PF09196 was obtained by conducting 3 HMMER iterations against the MGnify sequence database. The whole process, including COMER2 profile construction and searching the Swiss-Prot90 database, took 36 min to run on the COMER web server.
This time, the most significant was the alignment (E-value=0.0011; 24% sequence identity) with an annotated entry P9WQ20, Mycobacterium tuberculosis putative maltooligosyl trehalose synthase. COMER2 aligned the corresponding domain of P9WQ20 that shares the same fold with PF09196 (see the Figure). The high overall structural similarity of 3hje and P9WQ20 (TM-score=0.947) suggests that the two share a common functional mechanism.
Execution times
The two tables below show the execution times for various settings when conducting COMER2 searches against the UniProtKB/Swiss-Prot90 and PDB70 profile databases, respectively, with Swiss-Prot90 sequences. These times were obtained using the server's API. Another dozen seconds would be required to render results in the graphical user interface.
The sequences were searched against the HHsuite databases UniRef30 [14] and BFD [15] using HHblits and against the sequence databases UniRef50 [16] and MGnify [17] using HMMER. MSAs obtained from the HHblits search against UniRef30 (MSA query) and COMER2 profiles constructed from these MSAs (Profile query) were used separately to query the server instructed to skip sequence searches. All other settings were set to default values.
| UniProtKB/Swiss-Prot90 searches | |||||||
|---|---|---|---|---|---|---|---|
| Seq. ID | Length | Execution time (sec) | |||||
| Profile query | MSA query | HHblits+UniRef30 | HHblits+BFD | HMMER+UniRef30 | HMMER+MGnify | ||
| Q27YE2 | 101 | 17 | 19 | 73 | 121 | 217 | 1351 |
| Q05239 | 101 | 18 | 20 | 74 | 125 | 217 | 1344 |
| P29069 | 101 | 17 | 19 | 69 | 115 | 217 | 1356 |
| A4PBQ0 | 206 | 16 | 20 | 82 | 138 | 233 | 1356 |
| P19743 | 206 | 16 | 20 | 80 | 134 | 216 | 1358 |
| Q86W67 | 206 | 16 | 20 | 80 | 136 | 217 | 1346 |
| O94577 | 502 | 22 | 30 | 120 | 189 | 333 | 1600 |
| Q6GZV8 | 502 | 24 | 30 | 118 | 196 | 228 | 1713 |
| P52638 | 503 | 23 | 29 | 100 | 198 | 228 | 1338 |
| P50535 | 1039 | 40 | 52 | 272 | 439 | 1221 | 2844 |
| Q0WVX5 | 1040 | 45 | 216* | 920 | 1612 | 1475 | 3967 |
| P42835 | 1041 | 40 | 52 | 226 | 372 | 623 | 2168 |
| Q6UDF2 | 2033 | 75 | 99 | 399 | 586 | 755 | 3865 |
| Q54GV0 | 2036 | 73 | 97 | 525 | 864 | 5550 | 12240 |
| Q92576 | 2039 | 78 | 219 | 797 | 766 | 3013 | 6190 |
| A2AAE1 | 5005 | 163 | 447 | 1285 | 1456 | 5133 | 10240 |
| Q9SRU2 | 5098 | 198 | 534 | 1617 | 1617 | 5373 | 13979 |
| Q8SX83 | 5560 | 231 | 291 | 1086 | 1791 | 32106 | 39097 |
| Q9N4M4 | 8545 | 394 | 1555* | 5644 | 5252 | 21185 | 18931 |
| W6RTA4 | 8922 | 352 | 1182* | 4847 | 3407 | 28727 | 17752 |
| Q8I3Z1# | 9999 | 345 | 683 | 2452 | 4956 | 61335 | 58382 |
| PDB70 searches | |||||||
|---|---|---|---|---|---|---|---|
| Seq. ID | Length | Execution time (sec) | |||||
| Profile query | MSA query | HHblits+UniRef30 | HHblits+BFD | HMMER+UniRef30 | HMMER+MGnify | ||
| Q27YE2 | 101 | 9 | 12 | 66 | 113 | 209 | 1274 |
| Q05239 | 101 | 9 | 12 | 66 | 118 | 210 | 1268 |
| P29069 | 101 | 9 | 11 | 61 | 108 | 210 | 1280 |
| A4PBQ0 | 206 | 9 | 13 | 75 | 130 | 225 | 1276 |
| P19743 | 206 | 8 | 13 | 73 | 126 | 208 | 1279 |
| Q86W67 | 206 | 8 | 12 | 72 | 128 | 208 | 1266 |
| O94577 | 502 | 8 | 14 | 104 | 174 | 318 | 1513 |
| Q6GZV8 | 502 | 8 | 14 | 102 | 181 | 213 | 1626 |
| P52638 | 503 | 8 | 15 | 86 | 183 | 212 | 1250 |
| P50535 | 1039 | 10 | 22 | 242 | 409 | 1189 | 2746 |
| Q0WVX5 | 1040 | 11 | 178* | 882 | 1578 | 1440 | 3870 |
| P42835 | 1041 | 10 | 22 | 196 | 342 | 592 | 2070 |
| Q6UDF2 | 2033 | 14 | 38 | 338 | 525 | 694 | 3773 |
| Q54GV0 | 2036 | 14 | 38 | 466 | 805 | 5493 | 12149 |
| Q92576 | 2039 | 15 | 159 | 737 | 703 | 2948 | 6099 |
| A2AAE1 | 5005 | 26 | 326 | 1164 | 1317 | 4992 | 10103 |
| Q9SRU2 | 5098 | 33 | 382 | 1465 | 1455 | 5202 | 13806 |
| Q8SX83 | 5560 | 33 | 93 | 888 | 1582 | 31881 | 38869 |
| Q9N4M4 | 8545 | 58 | 1206* | 5295 | 4914 | 20828 | 18636 |
| W6RTA4 | 8922 | 51 | 876* | 4541 | 3104 | 28415 | 17445 |
| Q8I3Z1# | 9999 | 49 | 388 | 2157 | 4656 | 61031 | 58086 |
Limits
- Maximum query length = 9999.
- Maximum number of queries in the input field for COMER searches = 100.
- Maximum text size in the input field = 5MB.
- Maximum file size of queries for upload = 50MB.
- Maximum number of single-template 3D structural models for generating them simultaneously = 50.
- Maximum number of structural templates for one 3D model = 7.
The maximum duration of a job is limited to 24 hours. A job will be canceled and the user will be notified when that time expires.
If some of a job's queries fail, the error log will contain a short description of a problem, which will be visible to the user. The results of the other successfully completed queries of the same job will be available for analysis as usual.
References
- Margelevičius M. Bayesian nonparametrics in protein remote homology search. Bioinformatics. 2016;32(18):2744-52.
- Margelevičius M. COMER2: GPU-accelerated sensitive and specific homology searches. Bioinformatics. 2020;36(11):3570-3572.
- Remmert M, Biegert A, Hauser A, Söding J. HHblits: lightning-fast iterative protein sequence searching by HMM-HMM alignment. Nat Methods. 2011;9(2):173-5.
- Eddy SR. Accelerated Profile HMM Searches. PLoS Comput Biol. 2011;7(10):e1002195.
- Jones D. Protein secondary structure prediction based on position-specific scoring matrices. J Mol Biol 1999;292(2):195–202.
- Webb B, Sali A. Protein Structure Modeling with MODELLER. Methods Mol Biol. 2017;1654:39-54.
- Burley S, Bhikadiya C, Bi C, Bittrich S, Chen L, Crichlow G, Christie C, Dalenberg K, Di Costanzo L, Duarte J, et al. RCSB Protein Data Bank: powerful new tools for exploring 3D structures of biological macromolecules for basic and applied research and education in fundamental biology, biomedicine, biotechnology, bioengineering and energy sciences. Nucleic Acids Res. 2021;49(D1):D437-D451.
- Chandonia J, Fox N, Brenner S. SCOPe: classification of large macromolecular structures in the structural classification of proteins-extended database. Nucleic Acids Res. 2019;47(D1):D475-D481.
- Mistry J, Chuguransky S, Williams L, Qureshi M, Salazar G, Sonnhammer E, Tosatto S, Paladin L, Raj S, Richardson L, et al. Pfam: The protein families database in 2021. Nucleic Acids Res. 2021;49(D1):D412-D419.
- UniProt Consortium. UniProt: the universal protein knowledgebase in 2021. Nucleic Acids Res. 2021;49(D1):D480-D489.
- Schaeffer R, Liao Y, Cheng H, Grishin N. ECOD: new developments in the evolutionary classification of domains. Nucleic Acids Res. 2017;45(D1):D296-D302.
- Galperin M, Wolf Y, Makarova K, Vera Alvarez R, Landsman D, Koonin E. COG database update: focus on microbial diversity, model organisms, and widespread pathogens. Nucleic Acids Res. 2021;49(D1):D274-D281.
- Lu S, Wang J, Chitsaz F, Derbyshire M, Geer R, Gonzales N, Gwadz M, Hurwitz D, Marchler G, Song J, et al. CDD/SPARCLE: the conserved domain database in 2020. Nucleic Acids Res. 2020;48(D1):D265-D268.
- Mirdita M, von den Driesch L, Galiez C, Martin M, Söding J, Steinegger M. Uniclust databases of clustered and deeply annotated protein sequences and alignments. Nucleic Acids Res. 2017;45(D1):D170-D176.
- Steinegger M, Mirdita M, Söding J. Protein-level assembly increases protein sequence recovery from metagenomic samples manyfold. Nat Methods. 2019;16(7):603-606.
- Suzek B, Wang Y, Huang H, McGarvey P, Wu C, and the UniProt Consortium. UniRef clusters: a comprehensive and scalable alternative for improving sequence similarity searches. Bioinformatics. 2015;31(6):926-32.
- Mitchell A, Almeida A, Beracochea M, Boland M, Burgin J, Cochrane G, Crusoe M, Kale V, Potter S, Richardson L, et al. MGnify: the microbiome analysis resource in 2020. Nucleic Acids Res. 2020;48(D1):D570-D578.